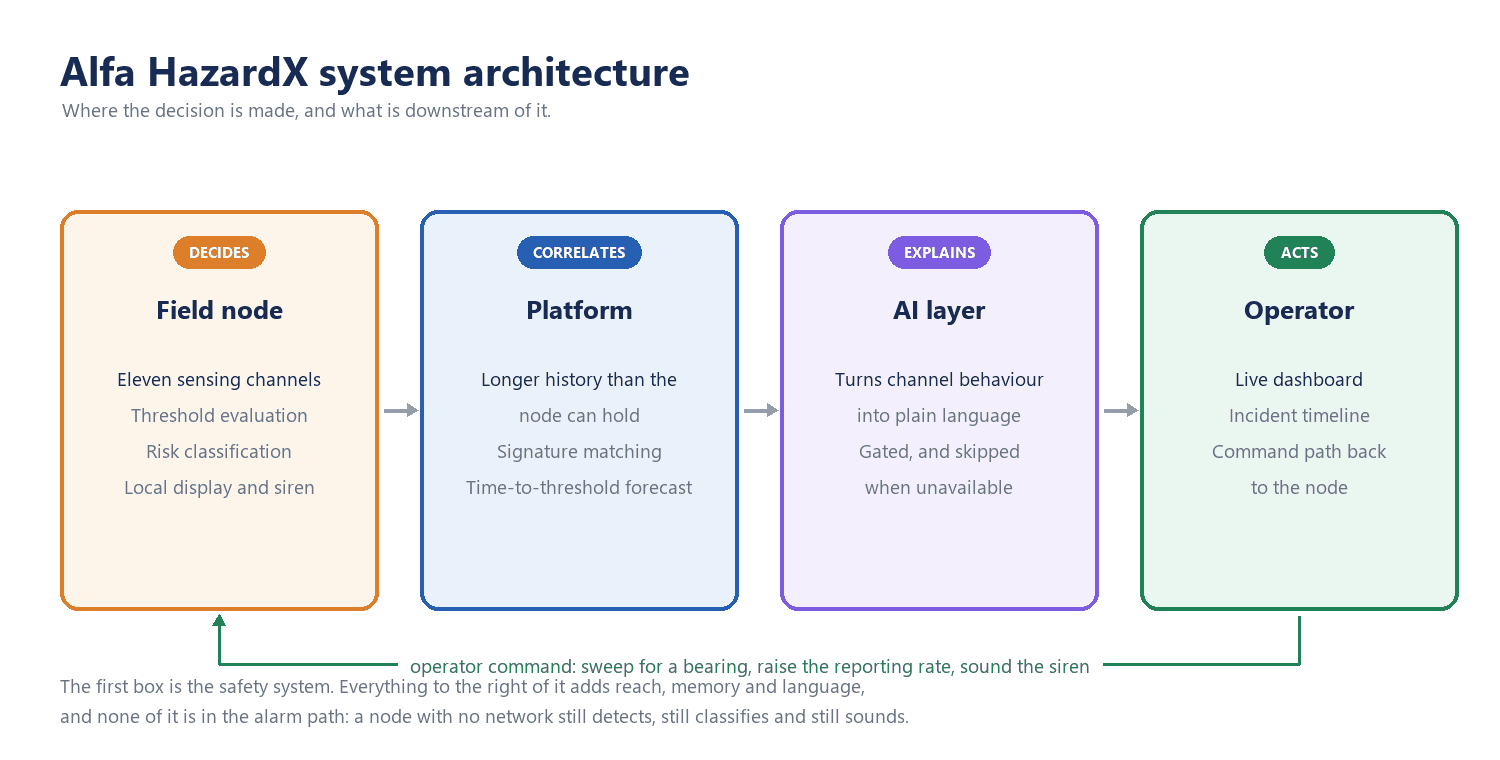
A reading travels through Alfa HazardX in eleven steps. The field node takes it and classifies it against per-sensor thresholds on the device. It is then posted to the cloud, stored, and checked for trend and time to threshold. Only if it needs explaining does it go to a generative model, which returns a severity, a cause and a recommended action. Serious breaches create an incident and an alert. The operator sees all of it in real time and can command the node back. If the network fails at any point, the node keeps detecting and keeps sounding its own alarm.
Alfa HazardX is a deployable V2 field node. It is not a certified industrial safety product, and nothing on this page should be read as a certification claim.
End-to-end architecture. A reading is acquired and classified on the node, then posted to the cloud and checked again against trend and baseline. It reaches the AI layer only when it needs explaining. Everything surfaces on the dashboard, from which an operator can command the node back.
How it works
See a hazard. Watch it get caught.
Eleven channels on one node. Move the control below and watch what the instrument does with the result — not the number on its own, which tells you very little, but how fast that number is moving, which is what actually separates a developing hazard from a sensor getting older.
Eleven measurement channels on one node, and the parts that carry them — three gas elements in a vented plenum, a flame photodiode, a camera, a microphone, ambient and surface temperature, and the node’s own siren. Hover one to see what it is for.
Gas concentration
12ppm
Risk
normal
Ordinary workshop air. The element is warm, the reading is steady, and this number on its own means very little.
Reading · ppmRate of change
Node state
Channels
09 online
Sampling
Baseline
Risk engine
Monitoring
Local alarm
Armed
Follow the signal
The whole path, end to end — from a hazard that has not crossed any limit yet, to an operator who knows which zone to walk to.
01
Environment
A hazard begins developing. Nothing has crossed any limit yet.
02
Sensor
The channel nearest the source starts to move away from its own baseline.
03
Hardware
The reading reaches the node. Sampling escalates from its slow baseline rate.
04
Processing
Velocity and acceleration are computed across every channel at once, on the device.
05
Risk
The movement matches a hazard signature and not the shape of drift.
06
Alert
The local alarm sounds. It does not wait for the network to agree.
07
Response
An operator gets the zone, the channels that moved, and what the node concluded.
What is real here: the enclosure and every sensor position, generated from the same parameter file the hardware is printed from. The MQ channels are self-calibrated against ambient air at boot. They are not calibrated against reference gas, so a ppm figure from them is indicative, not traceable. The readings above are a simulation for explanation — this site publishes no detection rate, response time or accuracy figure, because none has been measured under a documented methodology. What has and has not been established.
1. Sensor acquisition on the node
The node in block form: every sensing channel on the left, the local outputs on the right, and the controller that evaluates a threshold before either the display or the network hears about it.
Each field node carries eleven measurement channels on a single embedded controller. Four of them are gas: combustible gas and smoke, solvent and chemical vapour, carbon monoxide, and a broad air-quality index. Alongside those sit air temperature, humidity and barometric pressure, a contact probe reading surface temperature directly rather than inferring it from the air, three-axis vibration, sound level, an infrared flame channel, and a camera frame. Eleven readings, eight sensing elements, one board - the counts differ because one element can carry three channels.
Two details in the wiring matter more than they look. The flame sensor is inverted - a brighter flame pulls the analog value down, not up - so its threshold check is inverted throughout the firmware and the server-side evaluator. The gas channels also need a 24 to 48 hour burn-in before they read stably. After that, a per-device baseline is captured at boot. That baseline is the floor for percent-over-baseline figures, which is what makes one node's readings comparable with another's despite different ambient conditions.
2. Local risk classification
The per-sensor decision flow. Note the flame-active branch at the top - the inverted sensor is checked before the ordinary threshold cascade.
Before anything leaves the node, every reading is evaluated against per-sensor thresholds on the device. The result is one of four states - SAFE, WARN, DANGER or CRITICAL - and it is this local evaluation, not the cloud, that drives the on-device display and the buzzer.
That ordering is the whole point. The alarm is a property of the node, not of the network. A reading that classifies as CRITICAL sounds locally whether or not the Wi-Fi is up, whether or not the ingest endpoint is reachable, and whether or not any AI service is available or affordable.
3. The firmware control loop
The loop running on the node. Detection and local alarm complete before the publish step, so a failed upload cannot delay an alarm.
The node runs a continuous loop: sample every channel, latch the transient sensors, evaluate thresholds, drive the display and buzzer, then attempt to publish. Publishing is the only step that can fail without consequence for detection, and it is deliberately last.
4. Cloud ingestion
The ingest path: authenticate the device, validate and store the reading, evaluate it against more history than the node holds, then push to every subscribed dashboard.
By the time a reading leaves the node, the safety decision has already been made on the node. What travels to the platform is the reading and the verdict, over an authenticated path with per-device credentials, so a stolen unit yields nothing that cannot be revoked on its own.
What the platform adds is history and reach: a longer window than the node can hold, behaviour-signature matching across every node on the site, and the generative explanation. The dashboard is pushed to rather than polled, so a reading appears on screen in the time it takes to travel, not on the next refresh interval. None of that layer can stop the node alarming, and none of it has to be reachable for the node to alarm.
5. Deterministic prediction
Once readings accumulate, the system can do something a threshold alone cannot: say where a channel is heading. Linear regression over a recent window gives a trend, and comparing that trend against the threshold yields a time-to-threshold estimate - an ETA for when a channel will breach if it carries on as it is. Deviation from the per-device baseline is expressed as a z-score, so 'unusual for this node' is a measurable quantity rather than a judgement call.
This is the predictive layer, and it is deterministic. It is arithmetic over stored readings, it produces the same answer twice for the same input, and it is auditable after the fact.
6. Dual-layer analysis: what decides, and what explains
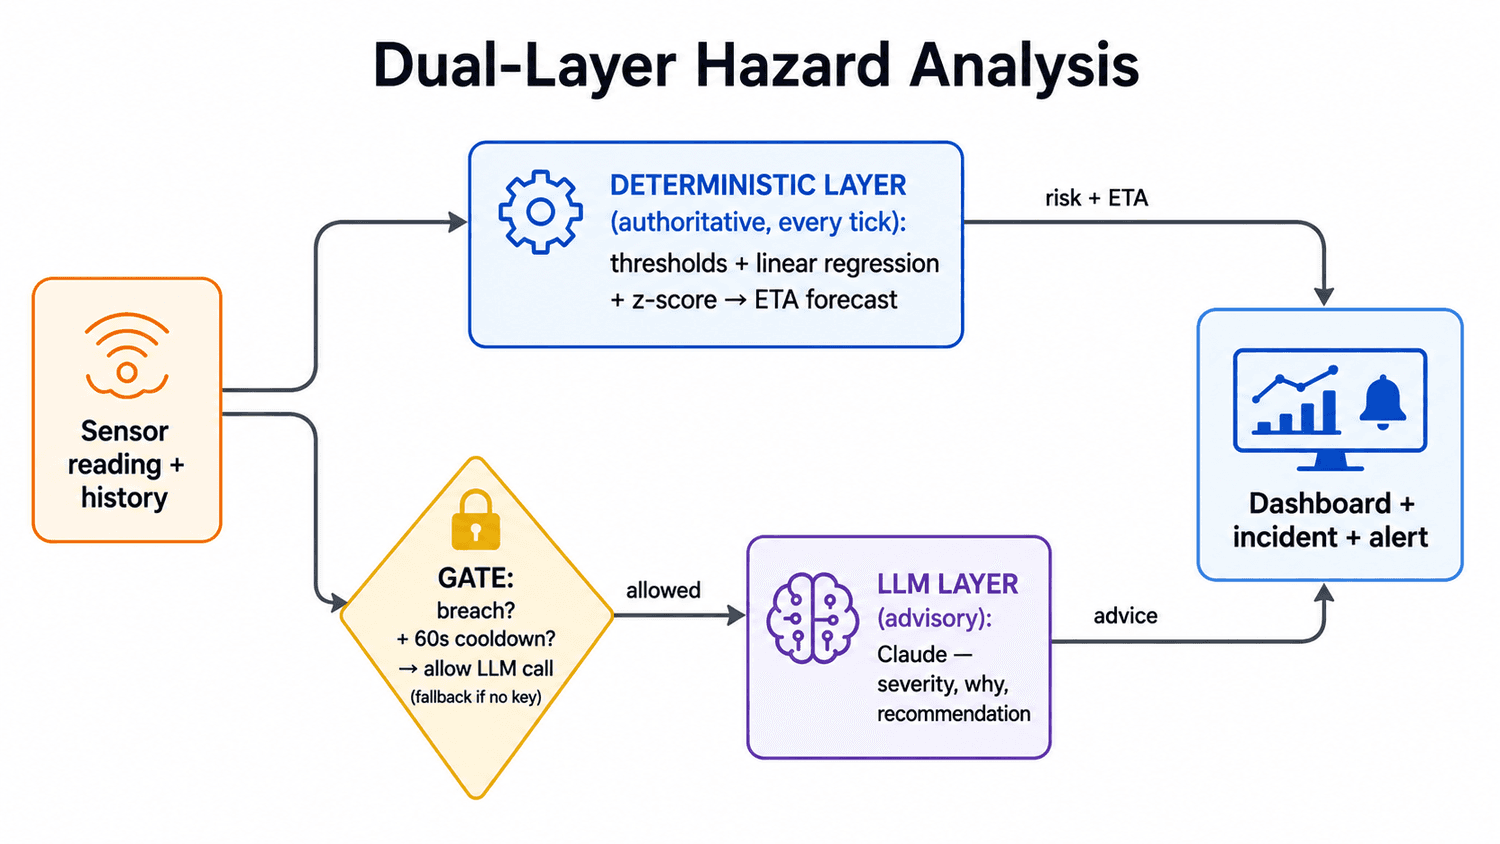
Two layers, different jobs. The deterministic engine decides risk on every reading. The AI layer explains, and only when invited.
The deterministic layer is authoritative: the absolute-limit floor, the behavioural signature layer and the local alarm decide the safety response. The generative-AI layer is advisory only, and structurally so - it has no software interface, permission or code path by which it can invoke any actuator, and the system runs undegraded when it is switched off.
The two layers run in parallel rather than in sequence. The deterministic engine classifies every reading on every tick. The generative layer is invoked selectively - and that gating is a cost control as much as an architectural one, since every call to a language model costs money and a node producing readings continuously could produce an unbounded bill.
7. AI gating
The gate. Severity opens it, a per-device cooldown limits how often, and an unavailable model falls through to deterministic output rather than blocking.
A threshold breach at WARN triggers an analysis call. Breaches at DANGER or CRITICAL do that and also create an incident row and a triggered alert. A per-device cooldown - sixty seconds in the current build - prevents a node sitting just over a threshold from generating a call on every reading.
When no model key is configured, or the model cannot be reached, the system falls back to threshold-only output. Nothing waits on the model, and nothing degrades except the quality of the explanation attached to an alarm that has already fired.
8. Incidents and the risk state machine
The risk state machine. Transitions - not raw readings - are what create incidents and alerts.
A hazard is not a single reading, and treating it as one produces either a flood of alerts or a missed event. Readings drive a risk state, incidents are created when that state crosses into DANGER or CRITICAL, and the threat timeline merges incidents and AI analyses into one realtime feed so an operator reads a sequence rather than a scatter of notifications.
9. The emergency command loop
The command round trip, from dashboard to node and back as an acknowledgement.
The path is not one-way. An operator watching the dashboard can command the node - triggering its on-site alarm remotely, so a person who can see the data can act on the floor where the hazard is.
This closes the loop between the plant and whoever is watching it, and it is the reason the system is a monitoring platform rather than a logger.
10. What the whole system exchanges
Level-1 data flow: the internal processes and stores, and the data moving between them.
At the context level the system has four counterparties: the field node it monitors, the safety officer who acts on alerts, the administrator who configures thresholds and access, and the AI service it consults. Everything else is internal.
11. What happens when things fail
Network down: detection, display and buzzer continue on the node. Readings buffer and resend when the link returns. The cost is dashboard visibility and AI analysis, not the alarm.
AI unavailable or unaffordable: the deterministic layer is unaffected, and output falls back to threshold-only. Alarms fire exactly as they would have.
Cloud unreachable: same as network down from the node's point of view. The node is the safety-critical component, and it is deliberately the one with the fewest dependencies.